|
Overview |
| 1. Demographic Trend of Japan | ||||||||||||||||||
|
According to the national census conducted on 1st October 2000, Japan's population is estimated to be approximately 127 million. As of 1998, Japan ranks as the 8th country in terms of population but is soon expected to drop out of top 10 due to stagnant population growth. The stagnant population growth can be explained by sharp drop of birth rate. 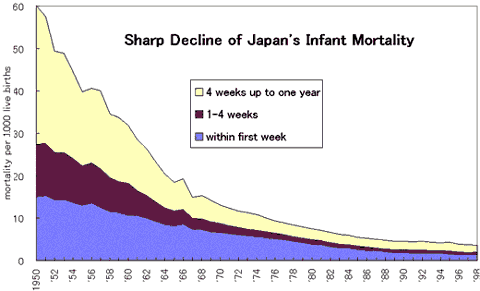 The crude fertility rate hit the record low of 1.34 in 1999. This is the lowest figure in the world except Italy with 1.19. On the other hand, mortality has consistently improved over the years. The improvement has been most prominent in infant mortality. Japan now boasts the world's lowest infant mortality with only 3.2 out of 1000 newborns die within the first year. This figure is comparable to Sweden (3.7 in 1997) and about half of that of the U.S. (7.1 in 1997) Improvement of mortality has prolonged life span to one of the longest in the world: 77.64 years for male and 84.62 years for female (2000 life table). Prolonged life span coupled with declining birth rate will inevitably make the entire population structure aging. According to the estimate, the percent of the elderly population, now 17.2%, will reach the peak of 32.3% in 2050. 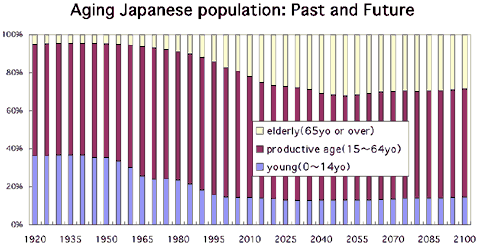 |
||||||||||||||||||
| 2. Birth rate | ||||||||||||||||||
|
Aging of Japan's population is attributable not only to prolonged life span but also to the sharp decline of birth rate. Japan once boasted of its high fertility rate. During 1947 through 1949, the first baby boom, the annual live birth was around 2.6 million or the crude fertility rate of 4. However, the crude fertility rate has consistently declined to the latest figure of 1.36 (2000), far below the replacement level. This figure is comparable with that of Germany (1.36, in 2000), higher than Italy (1.23, in 2000) but far lower than the U.S. (2.13 in 2000). A sharp decline in birth rate seen in 1961 was due to a superstition concerning the "fire horse" year according to the lunar calendar coming by every 60 years. 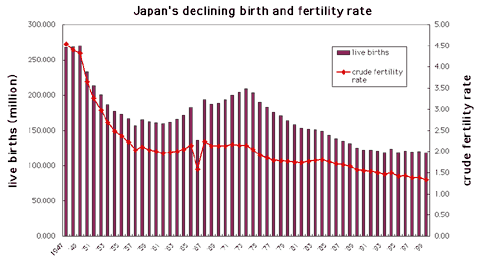 |
||||||||||||||||||
| 3. Mortality | ||||||||||||||||||
|
Crude mortality rate of Japan in 2000 was 7.7 per thousand. Crude mortality rate has been on a gradual increase since 1982 when the figure was 6.0 reflecting the aging of population. However, when the rate is age-adjusted, the mortality has consistently declined to the lowest of the developed countries. The decline was brought about first by the sharp decline of tuberculosis in the post war era and second by the sharp decline of cerebrovascular diseases. ![Age-Adjusted mortality [Male]](images/c0_4.gif) ![Age-Adjusted mortality [Female]](images/c0_5.gif) Japan's infant mortality, a sensitive indicator of national health condition, was 3.2 per thousand live births in 2000, one of the lowest in the world. This great achievement did not come at ease. Until as late as 1960s, Japan's infant mortality was considerably higher than that of the U.S. or U.K. It has been achieved through concerted efforts in effective maternal and child health activities. 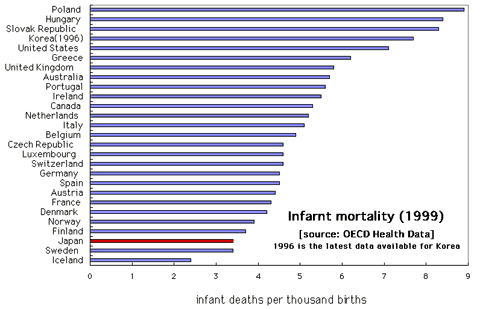 Congenital anomaly accounts for 36.2% of infant mortality and constitutes by far the largest cause of death. Since congenital anomaly is hard to prevent in public health perspectives, preventing SIDS or accidents will be a next challenge in the field of maternal and child health. 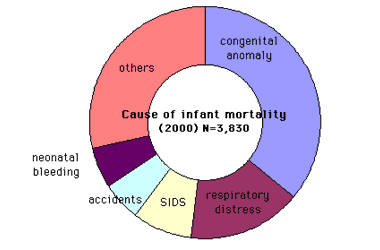 |
||||||||||||||||||
| 4. International Comparison | ||||||||||||||||||
Japan's morbidity pattern is considerably different from other industrialized countries. Take, for example, age-adjusted mortality by major causes of death among major OECD countries [Graph]. While no huge difference is observed for age-adjusted mortality of cancer, a considerable variation is seen for ischemic heart disease and cerebrovascular disease. Japan has low mortality from ischemic heart diseases together with Korea, while having a relatively high mortality due to cerebrovascular disease. These sharp differences may be explained by life style, diet and ethnic differences. However the gradual change in life styles and dietary habit is changing its morbidity pattern closer to that of present industrial countries.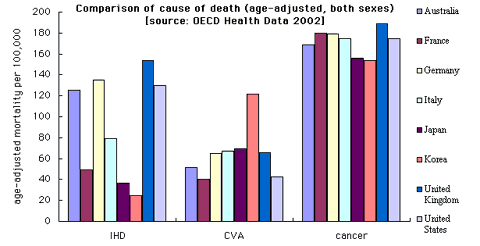 |
||||||||||||||||||
| 5. Administrative structure of public health | ||||||||||||||||||
|
Public health activities are provided predominantly by local governments under supervision of Ministry of Health, Labor and Welfare (MHLW). The front line of public health activities is public health centers (PHCs), which number 582 as of April 2002. There used to be 848 PHCs as of March 1994, when the Regional Health Act was enacted. The act was intended to delegate much of the personal services provided by PHCs to municipal health centers (MHCs) and the ensuing radical restructuring process reduced the number to 582. On the other hand, the number of MHCs has increased to 2,364 as of March 2001. The distinction between PHCs and MHCs may be confusing and warrant some further explanation. Both are the same in that both are part of local governmental bodies but PHCs are endowed with law enforcement power while MHCs are not. For example, when a mass food poisoning breaks out, it is PHC that assumes the responsibility to investigate the cause and take necessary action against the restaurants. Also all health care facilities such as hospitals, clinics and pharmacies are subject to periodic audit by PHC. What is confusing about the two is that both provide personal services. PHC and MHC share their responsibility by assigning more specialized and focused clients to PHC. For example, all doctors who diagnose tuberculosis are required to report to PHC and the patient record will be put into files maintained by PHC and kept under surveillance by public health nurses. On the other hand, MHC provides more general and community oriented services such as well baby clinic, immunization or mass health screening.
|
||||||||||||||||||
| 6. Training and research of public health | ||||||||||||||||||
For the sake of providing recurrent training for professional staff working for PHCs and MHCs, MHLW maintains National Institute of Public Health (NIPH). NIPH expanded its size and scope after merging with National Institute of Hospital Management in April 2002 and consolidated in a new campus in Wako city in the suburb of Tokyo [new symbol and photo of the new building is shown]. The new NIPH provides a variety of professional training and research activities in the field of not only public health but also hospital management and social welfare. MHLW funds research grants in the field of public health. The budget of health and labor related research grant has more than tripled from 1996 to 2002 (12 to 40.7 billion yen) reflecting a strong interest of the government in life science and genome research. Such research is likely to involve privacy issues. To facilitate research activities in public health field while protecting privacy of human subjects, MHLW enacted a guideline for epidemiological research, which took effect in July 2002 [translation is attached at the end]. |
||||||||||||||||||
| 7. International Cooperation and Contribution | ||||||||||||||||||
|
Japan is contributing a lot to the enhancement of public health in the world. More than 20% of WHO budget is contributed by Japan, second only to the U.S., which contributes 25%. Moreover, Japan promotes manpower exchange and training through JICA (Japan International Cooperation Agency) and other various NGOs, most famous of which is AMDA (Association of Medical Doctors in Asia). |
 
|